


- On average, 79% of U.S. adults nationwide are literate in 2024.
- 21% of adults in the US are illiterate in 2024.
- 54% of adults have literacy below a 6th-grade level (20% are below a 5th-grade level).
- Low levels of literacy costs the US up to 2.2 trillion per year.
- 34% of adults lacking literacy proficiency were born outside the US.
- In 2023, 46% of U.S. adults scored at or above Level 3 literacy proficiency, while 28% scored at or below Level 1.
- U.S. adults’ average literacy scores declined by 12 points from 2017 to 2023 according to PIAAC data.
- Massachusetts was the state with the highest rate of child literacy in 2024.
- New Mexico was the state with the lowest child literacy rate in 2024.
- New Hampshire was the state with the highest percentage of adults considered literate.
- The state with the lowest adult literacy rate was California.
- In 2024, 69% of 4th-grade children in the U.S. could not read proficiently (down from 66% in 2013).

Adult Literacy Statistics

- The literacy rate for adults across the U.S. averages 79% as of 2024.
- 20% of adults read below a 5th-grade level.
- 54% of adults read below a 6th-grade level.
- Between 2012 and 2017, the Program for the International Assessment of Adult Competencies (PIAAC) surveyed the abilities of 12,330 adults between 16 – 74 years of age, with representatives from every U.S. county and state as well as the District of Columbia.
- Based on the PIAAC survey for the years 2012, 2014, and 2017, the average score nationwide in the U.S. was 264 out of 500 points.
- In the 2023 PIAAC round, U.S. adults’ average literacy score declined by 12 points compared to 2017.
- In 2023, 28% of U.S. adults scored at or below Level 1 literacy, while 46% scored at Level 3 or above.
- New Hampshire, Minnesota, and North Dakota had the highest rates of literacy, in descending order.
- Florida, New York, and California had the lowest rates of literacy, also in descending order.
Also, check out this page on US reading statistics.
Adult Literacy Rate and PIAAC Score Estimate by State
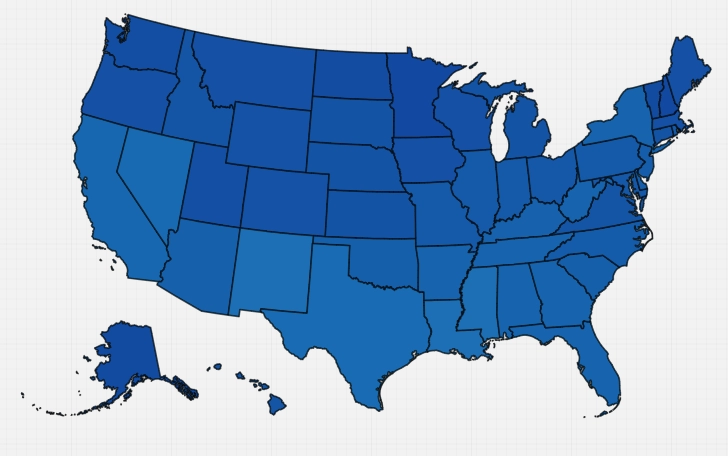
| State | Literacy Rate (%) | Literacy Rank | PIAAC Estimate | PIAAC Rank |
| Alabama | 85.2 | 39 | 259 | 44 |
| Alaska | 90.8 | 19 | 277 | 5 |
| Arizona | 86.9 | 33 | 262 | 37 |
| Arkansas | 86.3 | 37 | 259 | 45 |
| California | 76.9 | 50 | 257 | 46 |
| Colorado | 90.1 | 22 | 272 | 16 |
| Connecticut | 91.4 | 15 | 271 | 18 |
| Delaware | 89.3 | 26 | 264 | 34 |
| District of Columbia | n/a | n/a | 277 | 4 |
| Florida | 80.3 | 48 | 259 | 43 |
| Georgia | 83.3 | 45 | 260 | 39 |
| Hawaii | 84.1 | 40 | 270 | 22 |
| Idaho | 89.5 | 25 | 270 | 24 |
| Illinois | 87.1 | 32 | 266 | 31 |
| Indiana | 92.0 | 12 | 266 | 27 |
| Iowa | 92.5 | 9 | 273 | 9 |
| Kansas | 92.2 | 11 | 271 | 19 |
| Kentucky | 87.8 | 29 | 261 | 38 |
| Louisiana | 84.0 | 41 | 252 | 51 |
| Maine | 92.6 | 8 | 273 | 11 |
| Maryland | 88.8 | 27 | 268 | 26 |
| Massachusetts | 90.1 | 23 | 273 | 13 |
| Michigan | 91.7 | 13 | 271 | 21 |
| Minnesota | 94.0 | 2 | 279 | 2 |
| Mississippi | 84.0 | 42 | 252 | 49 |
| Missouri | 92.5 | 10 | 266 | 30 |
| Montana | 91.2 | 16 | 273 | 14 |
| Nebraska | 92.7 | 6 | 271 | 17 |
| Nevada | 83.9 | 43 | 255 | 47 |
| New Hampshire | 94.2 | 1 | 279 | 1 |
| New Jersey | 83.1 | 46 | 264 | 33 |
| New Mexico | 83.5 | 44 | 252 | 50 |
| New York | 77.9 | 49 | 260 | 42 |
| North Carolina | 86.4 | 36 | 265 | 32 |
| North Dakota | 93.7 | 3 | 276 | 6 |
| Ohio | 90.9 | 18 | 268 | 25 |
| Oklahoma | 87.7 | 30 | 263 | 35 |
| Oregon | 89.8 | 24 | 273 | 10 |
| Pennsylvania | 87.4 | 31 | 266 | 28 |
| Rhode Island | 91.5 | 14 | 266 | 29 |
| South Carolina | 85.3 | 38 | 263 | 36 |
| South Dakota | 93.0 | 5 | 271 | 20 |
| Tennessee | 86.8 | 34 | 260 | 40 |
| Texas | 81.0 | 47 | 254 | 48 |
| Utah | 90.6 | 20 | 274 | 8 |
| Vermont | 93.4 | 4 | 277 | 3 |
| Virginia | 88.0 | 28 | 270 | 23 |
| Washington | 90.2 | 21 | 275 | 7 |
| West Virginia | 86.6 | 35 | 260 | 41 |
| Wisconsin | 92.7 | 7 | 273 | 12 |
| Wyoming | 91.1 | 17 | 272 | 15 |
| Average | 88 | 25.5 | 264 | 26 |
Child Literacy Statistics
According to the 2018 Digest of Education Statistics, reading scores for most children in 4th and 8th grade were measurably higher in 2017 than they were in 1992, though not measurably higher than they were in 2015.
Additionally, the performance gap between certain ethnic groups, such as between White and Black students and between White and Hispanic groups, decreased significantly between 1992 and 2017, though not very much between 2015 and 2017.
- On average, in 2017, female 8th graders scored 10 points higher than male 8th graders on the reading portion of the Average National Assessment of Educational Progress.
- Fourth-grade students, overall, improved 5 points between 1992 and 2017, while 8th-grade students, overall, improved 7 points between 1992 and 2017.
- In 2024 NAEP results, only 31% of 4th graders scored at or above NAEP Proficient, meaning 69% were reading below proficiency levels.
- In 2024, 40% of 4th graders scored below Basic proficiency.
- The Top 3 states for the highest child literacy rates in 2024 were Massachusetts, Maryland, and New Hampshire, in that order (highest to lowest).
- The Bottom 3 states for child literacy rates in 2024 were Louisiana, Mississippi, and New Mexico (highest to lowest).
- Across the U.S., 66% of all 4th graders in 2013 were reading below proficiency levels, which was a 6% improvement from 2003.
Child Literacy Statistics by State (4th Grade)
| State | Rank (lower is better) | Students Not Reading Proficiently (%) | Lower Income Students Not Reading Proficiently (%) | Higher Income Students Not Reading Proficiently (%) | Improvement since 2003 (%) |
|---|---|---|---|---|---|
| Alabama | 35 | 69 | 82 | 51 | 12 |
| Alaska | 44 | 73 | 85 | 60 | -1 |
| Arizona | 40 | 72 | 85 | 57 | 6 |
| Arkansas | 32 | 68 | 78 | 54 | 6 |
| California | 43 | 73 | 85 | 54 | 8 |
| Colorado | 8 | 59 | 79 | 54 | 6 |
| Connecticut | 5 | 57 | 81 | 43 | 0 |
| Delaware | 13 | 62 | 75 | 48 | 7 |
| District of Columbia | 45 | 77 | 87 | 39 | 14 |
| Florida | 12 | 61 | 73 | 42 | 10 |
| Georgia | 26 | 66 | 79 | 47 | 10 |
| Hawaii | 37 | 70 | 83 | 57 | 11 |
| Idaho | 31 | 67 | 78 | 56 | 4 |
| Illinois | 28 | 66 | 84 | 48 | 4 |
| Indiana | 14 (tied) | 62 | 75 | 49 | 7 |
| Iowa | 16 | 62 | 77 | 52 | 5 |
| Kansas | 14 (tied) | 62 | 78 | 46 | 7 |
| Kentucky | 21 | 64 | 77 | 49 | 7 |
| Louisiana | 46 | 77 | 85 | 58 | 4 |
| Maine | 19 (tied) | 63 | 76 | 52 | 2 |
| Maryland | 2 | 55 | 76 | 42 | 19 |
| Massachusetts | 1 | 53 | 75 | 38 | 12 |
| Michigan | 34 | 69 | 81 | 58 | -1 |
| Minnesota | 9 | 59 | 77 | 48 | 6 |
| Mississippi | 47 | 79 | 85 | 58 | 4 |
| Missouri | 23 | 65 | 77 | 51 | 2 |
| Montana | 24 | 65 | 78 | 54 | 0 |
| Nebraska | 19 (tied) | 63 | 77 | 51 | 7 |
| Nevada | 42 | 73 | 83 | 56 | 9 |
| New Hampshire | 3 | 55 | 76 | 47 | 8 |
| New Jersey | 7 | 58 | 78 | 44 | 5 |
| New Mexico | 48 | 79 | 85 | 61 | 2 |
| New York | 18 | 63 | 77 | 47 | 5 |
| North Carolina | 22 | 65 | 78 | 47 | 3 |
| North Dakota | 29 | 66 | 78 | 60 | 3 |
| Ohio | 17 | 63 | 80 | 48 | 5 |
| Oklahoma | 36 | 70 | 79 | 57 | 5 |
| Oregon | 30 | 67 | 79 | 50 | 3 |
| Pennsylvania | 10 | 60 | 77 | 45 | 10 |
| Rhode Island | 15 | 62 | 81 | 45 | 13 |
| South Carolina | 39 | 72 | 83 | 54 | 3 |
| South Dakota | 33 | 68 | 82 | 58 | -1 |
| Tennessee | 27 | 66 | 82 | 48 | 11 |
| Texas | 38 | 72 | 83 | 53 | -1 |
| Utah | 20 (tied) | 63 | 76 | 54 | 7 |
| Vermont | 6 | 58 | 74 | 46 | 8 |
| Virginia | 4 | 57 | 79 | 44 | 12 |
| Washington | 11 | 60 | 77 | 47 | 10 |
| West Virginia | 41 | 73 | 76 | 63 | -3 |
| Wisconsin | 25 | 65 | 80 | 53 | 3 |
| Wyoming | 20 (tied) | 63 | 76 | 54 | 5 |
| Average | 24 | 66 | 80 | 49 | 6 |
Literacy Rate By Country 2025
The following table provides an overview of the literacy rates for 20 diverse countries around the world, reflecting data available as of 2025.
The 79% figure (U.S. adults) comes from PIAAC (Program for the International Assessment of Adult Competencies) and measures functional literacy – the ability to read and comprehend texts at a practical, everyday level (like understanding job applications, medical forms, news articles, etc.).
The 99% figure (country comparison) represents basic literacy – simply the ability to read and write at a minimal level (usually defined as being able to read and write a simple sentence about one’s daily life). This is the UNESCO standard used for international comparisons.
These figures represent the percentage of the population aged 15 and over who can read and write, though definitions and methodologies may vary by country.
| Country | Literacy Rate (%) |
|---|---|
| Australia | 99 |
| Brazil | 93 |
| Canada | 99 |
| China | 96.4 |
| Egypt | 75.6 |
| France | 99 |
| Germany | 99 |
| India | 74.4 |
| Indonesia | 95.4 |
| Italy | 99 |
| Japan | 99 |
| Kenya | 81.5 |
| Mexico | 94.5 |
| Nigeria | 62 |
| Pakistan | 59.1 |
| Russia | 99.7 |
| South Africa | 94.4 |
| Turkey | 96.2 |
| United Kingdom | 99 |
| United States | 99 |
Workplace and Economic Impact of Literacy
- In 2024, 88% of companies reported being affected by low levels of literacy and numeracy to a high, moderate, or slight degree.
- More than half of American adults (57%) read at Level 2 or below, making it difficult to obtain, maintain, or advance in employment.
- Approximately 28% of adults (about 58.9 million people) read at the lowest literacy levels, limiting their reading comprehension to simple, short sentences.
- The average annual income for adults reading at a 6th-grade level is $63,000, compared to $48,000 for those reading at a 3rd- to 5th-grade level, and just $34,000 for those reading below a 3rd-grade level.
- Low literacy significantly reduces the likelihood of career advancement and increased pay for employed adults.
- Adults with low literacy levels are more likely to experience unemployment and job instability compared to their more literate peers.
- The $2.2 trillion annual economic cost of low literacy includes lost productivity, reduced tax revenue, and increased spending on social services and healthcare.
- Workers with higher literacy levels contribute more effectively to workplace productivity and are better equipped to adapt to changing job requirements.
- Low literacy creates barriers to understanding workplace safety instructions, employee handbooks, and training materials, increasing workplace accidents and errors.
Health and Financial Literacy Statistics
- Nearly 90% of Americans struggle to understand basic healthcare information, creating a hidden crisis in the healthcare system.
- Limited health literacy costs the U.S. healthcare system an estimated $236 billion annually through poor health outcomes, medication errors, and increased hospitalizations.
- Health literacy challenges disproportionately affect marginalized populations, particularly impacting Medicaid members and low-income communities.
- Complex medical language, confusing insurance terminology, and inadequate patient education materials contribute to widespread health literacy problems.
- As of 2024, financial literacy in the United States has hovered around 50% for eight consecutive years, with Americans correctly answering only 48-49% of financial literacy questions.
- Understanding financial risk is particularly low, with only 35-36% of risk-related financial questions answered correctly in 2024, down from 39% in 2017.
- Gen Z scored lowest on financial literacy assessments, correctly answering only 38% of financial literacy questions on average in 2025.
- College graduates scored 63% on financial literacy assessments, compared to just 35% for those with only a high school diploma.
- The percentage of U.S. adults demonstrating “very low” levels of financial literacy increased from 20% in 2017 to 25% in 2023.
- Only 28% of Americans earning less than $25,000 per year are financially literate, compared to 58% of those earning over $100,000.
- The lack of financial literacy cost Americans an estimated $388 billion in 2023 through poor financial decisions, high-interest debt, and missed investment opportunities.
- Significant gaps persist in financial literacy among demographic groups, including women and Hispanic and Black Americans.
- Individuals with very low levels of financial literacy are seven times more likely to spend 20 hours or more per week dealing with personal finance-related issues.
References
- U.S. Department of Education Data Points Adult Literacy in the United States
- NCES Program for the International Assessment of Adult Competencies
- What is PIAAC?
- Digest of Education Statistics 2018
- Literacy Project – 30 Key Child Literacy Stats Parents Need to Be Aware of
- NCES States and Counties with Highest and Lowest Levels of Adult Literacy
- NCES PIAAC Skills Map
- NCES PIACC Comparison Charts
- World Population Review U.S. Literacy Rates by State
- States Where Children Are Struggling the Most to Read
- AECF Data Snapshot Early Reading Proficiency